What’s Possible With Box Theory™ All-In-One Software for Creating Better Business Systems?
Other

What customers say…

Wade Carpenter – Carpenter & Company, CPA
“Box Theory Gold software not only has a way to organize the systems, but also a unique way of assessing what systems to work on first that can have the biggest impact on a business. The tools to build and maximize each system are built right in, and once you have them created, it also provides a framework for measuring and managing those systems.”

Ron here…

“I’ve spent 14 years at great cost to bring the powerful business-improvement principles used by large companies to the world of small-business. I am very proud of Box Theory™ Software and know that it can help you create a remarkable business! I invite you to give it a try at no risk, and put me to the test.”
Questions?
Email me, Ron Carroll, BoxTheryGold@gmail.com
You may also be interested in other topics:
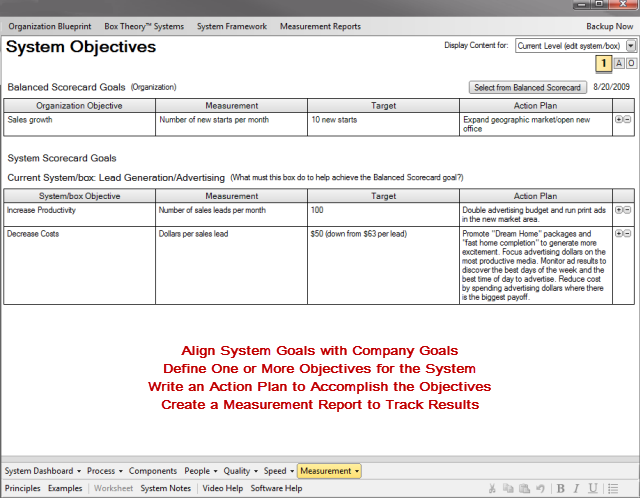
Set system objectives, manage by the numbers, and track the key performance indicators (KPIs) that drive your “economic engine.”
System Objectives: Develop system objectives that are aligned with your business objectives.
Measuring system performance and providing feedback to team operators drives process improvement. Begin the measurement process by defining what it is you want to measure, how you will measure it, and the desired outcome.
- Set System Objectives to help accomplish your company objectives.
- Measure productivity, quality, cycle time, resource utilization, or costs.
- Create an action plan to reach your target objectives.
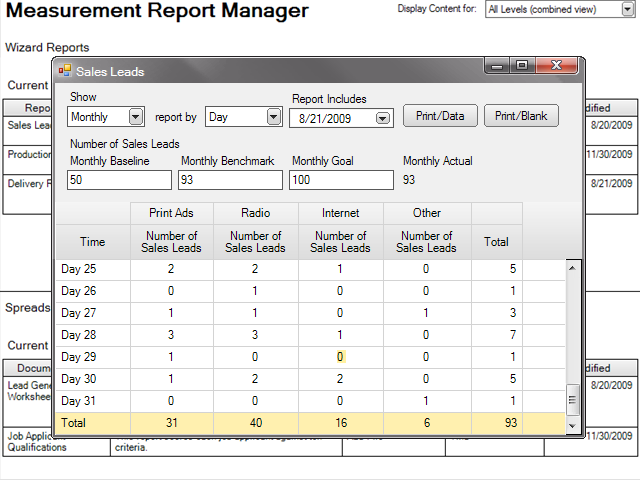
Measurement Report Wizard: Create fully-formated reports in minutes and track your performance data; numbers are the language of improvement.
Create and manage measurement reports to track the performance of each business system. Compare the data to your system objective(s) and use it as the basis for process improvement. Create measurement reports using the Box Theory™ Report Wizard or by using a standard spreadsheet program like Microsoft Excel.
- The Measurement Report Wizard asks you a few simple questions about what you are measuring and then creates a fully-formatted report ready for adding data.
- Data can be added and viewed for any selected time period (e.g. daily, weekly, monthly) and can be expressed as whole numbers or percentages. Totals reflect the time period selected.
- Compare actual system performance results with baseline, benchmark and goal numbers, and if appropriate, set the report totals as key performance indicators (KPIs) that show up in real-time on the System Dashboard and Home-Page Dashboard.
- From the main menu you have easy access to all measurement reports for quick data entry.
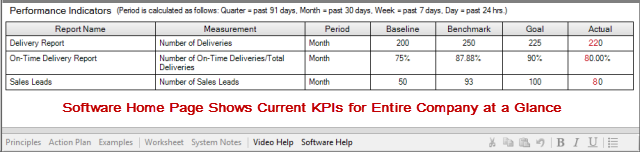
Key Performance Indicators (KPIs): On your home-page dashboard, follow the few key numbers that determine your success.
While it may be useful to measure the performance of any business system, there are only a few critical numbers that drive the “economic engine” of your organization. If these numbers are good, everything else falls into place. All business Owners should know their KPIs!
- Simply check a box on a new Measurement Report to describe it as a Key Performance Indicator.
- Running totals of KPIs—along with baseline, benchmark and goal numbers—appear on the System Dashboard and the Home-Page Dashboard for easy review.